Voltage droop characterization and on-chip fault detection on iCE40
aes source
I placed the on-chip sensor from my CPA work and the ring-oscillator grid from my DFA work on the same Lattice iCE40HX8K die. This let the sensor watch the supply rail while the grid attacked the same encryption. I wanted to measure how much droop it took to fault AES, but I found a cliff instead of a threshold. Every oscillator count below the full 4800 caused zero faults in 500 encryptions each. With the full grid, 39.2 percent of the encryptions faulted. Less than half a sensor code separates the two sides of this cliff.
The negative result was more useful to me. At a fixed injector setting, droop depth does not separate faulted encryptions from correct ones. The outcome depends on when the droop lands, rather than how deep it goes. A threshold detector using the same sensor gets an AUC of 1.000 for detecting the attack. Its AUC for identifying the ciphertexts that came out wrong is 0.500, which is chance.
What droop is and why it breaks a cipher
Every logic block on an FPGA shares one power distribution network. Switching logic draws current, so the rail sags before the network can restore it. Resistance in the metal causes part of the sag. Inductance resisting a sudden current change causes the rest. Gate delay grows as the supply falls, roughly as one over Vdd. When the slowest path no longer settles within one clock period, a flip-flop captures a value before the computation has finished.
In an AES core, this captured value causes a fault instead of a crash, and faults can leak keys. The attacker does not touch the victim circuit. This is the shared FPGA threat model: two tenants are isolated in logic but still use one power distribution network.
| Platform | Lattice iCE40HX8K, 40 nm |
|---|---|
| Aggressor | 4800 on-chip ring oscillators, 8-bit enable mask |
| Instrument | 64-tap carry-chain TDC, 0 to 64 codes |
| Victim | AES-128, 14 cycles per round |
The sensor is a time-to-digital converter. It measures how far a clock edge travels along a carry chain during half a clock period. That distance is a direct proxy for gate speed and therefore for the rail. A lower code means that the gates are slower. The code is not a voltage measurement, and its calibration applies to one die at one clock frequency.
The question the previous task left open
My DFA setup gave me fault rates for different injector settings, but one
result remained unexplained. Reducing the enable mask below
0xff, which means running fewer than all 4800 oscillators, reduced
the fault rate to zero rather than only lowering it. The behavioural table
could not explain this result because it recorded the consequence without
measuring the rail.
I built two bitstreams to separate sensor debugging from the AES experiment. The first contains the sensor and the grid without AES. This kept the characterization sweep cheap and let me debug the instrument without the AES design adding another possible cause. The second also contains the AES core, the injection state machine, and a threshold comparator. Its sensor trace, ciphertext, and alarm therefore come from the same encryption.
The decoder needs only seven bits from each stored byte, so I used bit 7 for the grid enable. This did not increase the stored data, and it made the droop phase relative to the victim measurable instead of assumed. I needed that bit later to determine whether phase, rather than droop depth, decided the fault.
Calibrating the sensor, and where it runs out of range
The delay chain uses the initlen parameter to consume part of the
edge travel before the 64-tap observation window begins. Since this is a
synthesis parameter, each candidate value required a separate bitstream and
a separate flash. The usable range on this die was narrow.
60 MHz   initlen 5, 6, 7 usable    idle 49, 39, 22 codes
36 MHz   initlen 11, 12 usable     idle 63, 50 codes
Below the usable range, the sensor pins at 64; above it, the sensor pins at 0.
I did not expect every initlen value to leave either the idle rail
or the full-load droop outside the window. At the settings that fault AES,
90 percent of the traces sit on the lower rail. This is an instrument range
limit rather than a calibration error, so I had to account for it in the
analysis.
Droop against oscillator count
I swept 486 operating points across mask, toggle period, and duty, with five repeats at each point. The resulting 2430 captures took 46 seconds at 1 Mbaud. At 60 MHz, with a baseline of 49 codes, a toggle period of 8, and a duty of 0.5, I measured:
oscillators   droop depth   samples below 0.9x baseline
        600          2.8                              0
       1200          5.2                              4
       1800          8.0                             13
       2400         12.0                             22
       3000         18.0                             56
       3600         18.0                            118
       4800         23.0                            143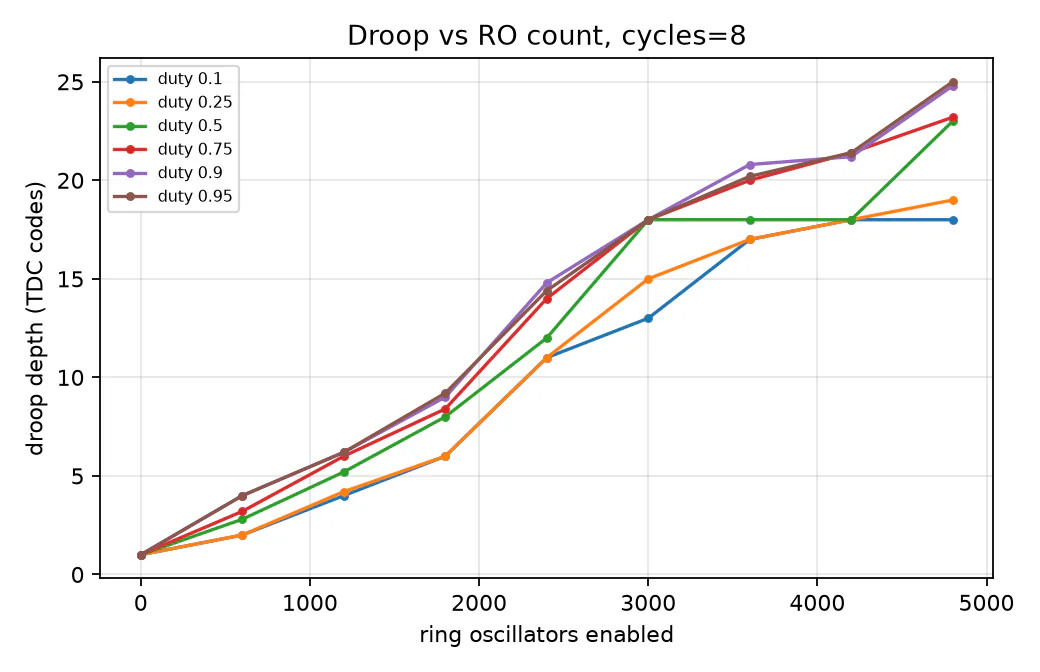
Droop increases monotonically with both oscillator count and duty. Fifteen percent of the captures reached the lower rail, all at long periods and high duty. I removed them from the curves and counted them separately because a pinned sensor does not provide a droop measurement. Treating those captures as measured values would make the plotted numbers wrong.
Overshoot and the recovery tail
Zick and colleagues report overshoot exceeding specification by more than ten times on 28 nm parts. I checked whether the same behaviour appeared on this 40 nm device. Across 162 captures with a fixed 128-cycle burst and a 31 microsecond settling window, the largest value in a recovery tail was one code above baseline. Since the idle reading also moves by one code, I cannot distinguish this overshoot from zero.
Instead, the rail recovers slowly and monotonically. With the full grid, this takes roughly 1500 cycles, or 25 microseconds. That is ten times longer than a complete AES encryption, which takes 141 cycles on this core, so the droop does not recover within one encryption. The UART transfer between encryptions takes milliseconds, which gives the rail time to recover before the next measurement.
My first sweep kept the grid on until the final sample and left no settling
window. The overshoot column therefore contained nan at every
continuously toggling point. I added an injlen field to the
protocol so that the grid could switch off during the capture. The metric now
reports overshoot only when the trace includes a complete recovery. Otherwise,
a short settling window would report an unfinished tail as a large negative
overshoot.
The merged design would not close timing
Before the board arrived, I treated the reported f_max of any build containing the sensor as meaningless. The delay chain is meant to consume most of a clock period, so nextpnr times it as a violation and reports a failure. That reasoning applies to the sensor-only design. It did not apply to the merged design, where an ordinary AES path also failed timing.
I first replaced the sensor with a counter and rebuilt, since I wanted to see
whether any ordinary path still failed timing. That build reported 62.38 MHz,
which appeared to leave enough margin. On the board, however, the bitstream I
was flashing produced incorrect fault-free ciphertexts non-deterministically,
with all sixteen bytes wrong each time. The build log showed why: the worst
path ran posedge to posedge through aes_inst.keysched_inst at
42.32 MHz against a 60 MHz target. This was ordinary logic, so the failure was
real.
Replacing the sensor had hidden the failure because it freed about 200 logic cells. This relieved the same congestion I needed to diagnose and produced a different placement from the bitstream I flashed. Reseeding did not help: seed 2 reached 39.34 MHz. Reducing the grid to 3600 oscillators also failed to help, reaching 42.72 MHz at 82 percent utilisation, so congestion from the grid itself was not the cause. My previous DFA top level reached 67.23 MHz through the same flow. This confirmed that the toolchain was working and that the sensor cost about 20 MHz.
I reduced the merged design to 36 MHz and kept all 4800 oscillators, since grid size is the variable this experiment measures. nextpnr then reported 41.24 MHz, with the worst path back on the delay chain. The FIPS-197 known-answer test passed 8 out of 8 times on hardware. This change gave AES 15 percent timing margin instead of the 6 percent it had at 60 MHz, so a fault required deeper droop. My build script now prints the clock-edge pair associated with the reported f_max, which is the check I should have had from the start.
The fault threshold is a cliff
I collected 10 000 encryptions across 20 operating points, with 500 at each point. For every encryption, I stored both the fault-free trace and the injected trace. The clean traces form the negative class needed to score a detector, and I could not recreate them after returning the board. The full run took five and a half minutes at 31 encryptions per second.
romask  oscillators  integrated droop  fault rate
  0x01          600              16.3       0.0 %
  0x03         1200              29.3       0.0 %
  0x07         1800              38.6       0.0 %
  0x0f         2400              42.9       0.0 %
  0x1f         3000              44.8       0.0 %
  0x3f         3600              45.9       0.0 %
  0x7f         4200              46.3       0.0 %
  0xff         4800              46.7      39.2 %
Mask 0x7f still produced zero faults at a period of 2000 cycles,
with 1999 cycles active. This is the most aggressive setting available from
the injector. The result rules out total injected energy as the cause of the
cliff. Only the complete grid crosses it, and 0.4 codes of integrated droop
separate a 0 percent fault rate from 39.2 percent.
I changed the x-axis because peak depth is censored in 90 percent of the traces. Excluding those traces would remove every operating point that produces faults. Integrated droop is the area between the baseline and the trace, and it remains monotone in the true droop after the minimum saturates. I therefore used integrated droop for the transfer curve and reported peak depth beside it as a censored quantity.
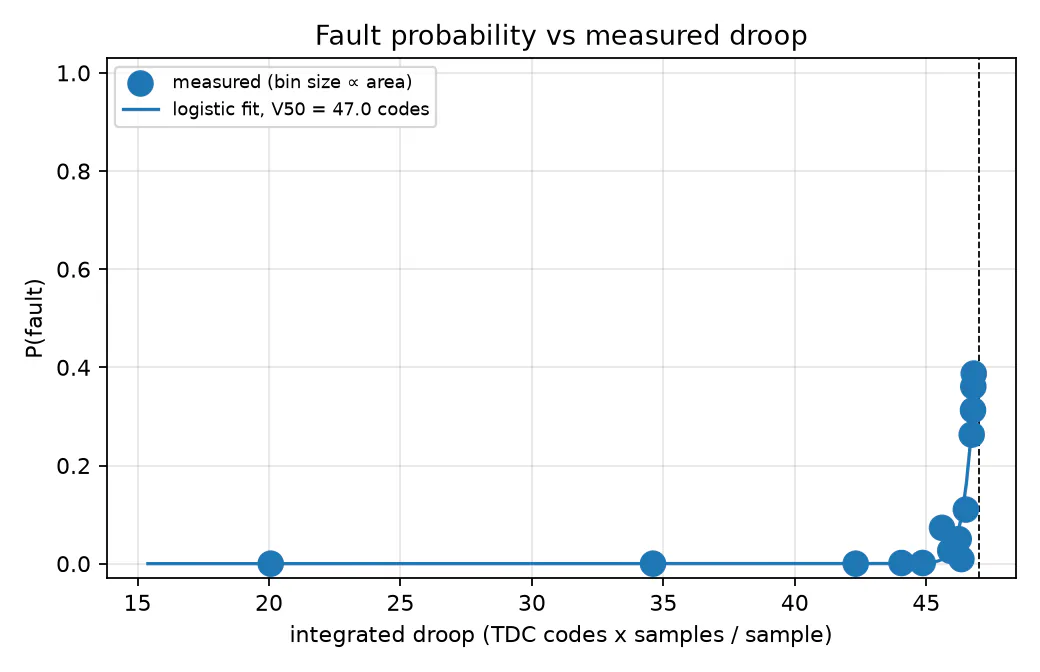
The fraction of single-byte faults, which are the faults usable for DFA, is non-monotonic. This matches the narrow ridge I observed behaviourally in the previous task. Here, I measured it against a physical axis rather than against injector settings.
Faults depend on droop phase
At one fixed operating point with a 42 percent fault rate, I compared droop between faulted and correct encryptions. The two measurements were 47.91 plus or minus 0.27 codes and 47.87 plus or minus 0.33 codes, with a Cohen's d of 0.14. Droop depth did not separate the two populations.
The populations separate by phase because the toggle counter runs freely and is not reset between encryptions. The droop therefore lands at a different point in each encryption. A single-byte fault usable for DFA must be captured during round 9. My simulation places that round at trace indices 113 to 127. The outcome depends on whether the droop covers this window, which is why I stored the grid-enable bit in every sample.
Attack detection does not identify faulty ciphertexts
The RTL comparator is four lines long. It counts consecutive samples below a programmable threshold and raises an alarm after k such samples. Both the threshold and k arrive over UART, which let me sweep them without rebuilding. Since the alarm is a pure function of a stored trace, I scored each configuration offline by replaying the same logic in Python. I used the board only to confirm that the RTL and the replay agreed.
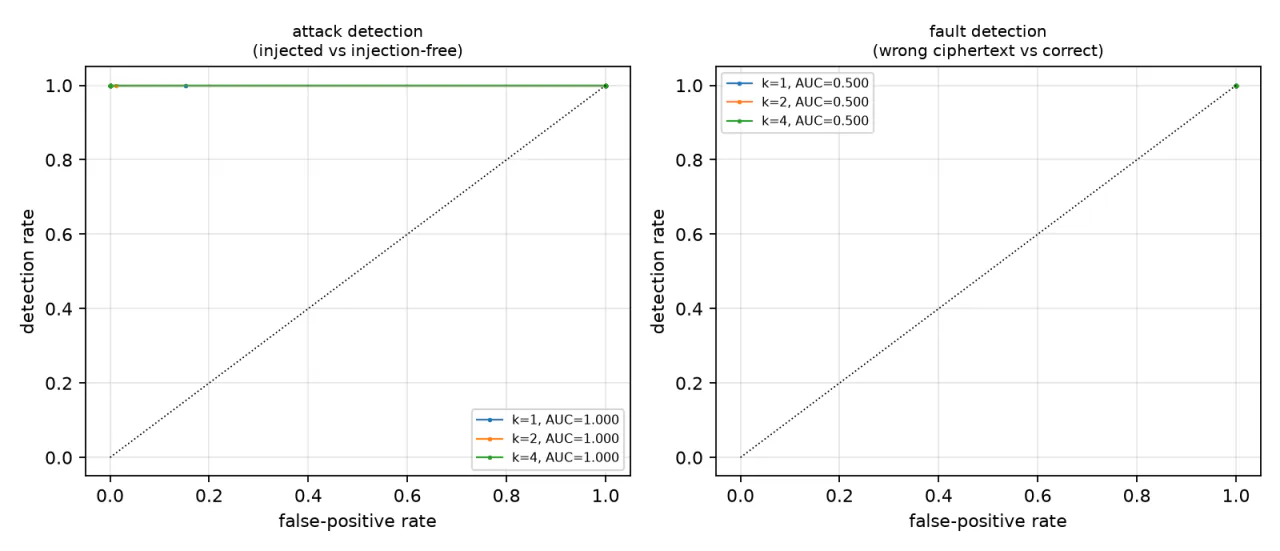
Attack detection reached an AUC of 1.000, although the droop saturating the sensor makes this an easy case. With a threshold of 46 and k of 2, the alarm fired on every injected encryption. Its false-positive rate on clean encryptions was 0.0000. The alarm fired a median of 110 cycles before round 9, so it arrived early enough to suppress the encryption instead of only invalidating it afterwards.
Fault detection reached an AUC of 0.500, which is chance. The sensor can tell that the grid is running, but the phase result explains why it cannot identify a particular incorrect ciphertext. This countermeasure can warn that an attack is active, but it cannot determine which results must be discarded. I measured both cases because reporting only attack detection would overstate what the defence provides.
My first comparison was wrong because I applied the sensor's two-cycle pipeline correction before replaying the detector model. The hardware comparator sees each sample when it arrives, without that shift. My first check compared only the alarm flag and not its index, so it reported perfect agreement while every latency measurement was two cycles wrong. I found the bug after adding index comparisons to the board acceptance test, which then failed 7 of 10 configurations. After I fixed the replay, the RTL and the model agreed on the alarm and its index for all 800 armed encryptions.
What I still do not know
I can only bracket the droop value where faults begin. I cannot give its exact
value because the sensor saturates below the fault threshold at 36 MHz, and no
initlen value covers both ends. Extending the instrument's range
would require either a longer tap line or a second sensor at another operating
point. I did not have enough board time to test either option.
The fault rate was more placement-sensitive than I expected: at the same operating point, one bitstream gave 39.2 and 43.2 percent, while another gave 94.2 percent. The second bitstream differed only in the length of the sensor's delay chain. I initially attributed 94.2 percent to die temperature because I measured it late in a session, after the oscillators had run for an hour. Repeating the measurement with the first bitstream afterwards gave 43.2 percent, so the change followed the bitstream rather than elapsed time. Changing the sensor chain changes placement, which changes the AES critical path and produces a factor-of-two difference in fault rate. Each absolute rate here therefore belongs to one bitstream hash.
I did not collect a multi-seed placement band for the characterization sweep because I used that board time to diagnose timing. Since the measurements show this much placement sensitivity, that band is the first missing experiment I would add.
These results transfer only weakly to a larger device. The HX8K has one core supply and no per-region regulation, so the grid loads the entire chip. On a large Xilinx or Intel part, droop from a localised aggressor decreases with distance. The grid and AES together occupy 97.7 percent of this device, while the same attack on a cloud FPGA places a small tenant beside a large victim. The sensor codes apply to one die at one clock frequency and do not represent volts. This AES core is small and sequential, taking 14 cycles per round, so its critical path does not represent a pipelined implementation.
References
- J. Krautter, D. R. Gnad, M. B. Tahoori, FPGAhammer: Remote Voltage Fault Attacks on Shared FPGAs, suitable for DFA on AES, TCHES 2018.
- D. R. Gnad, F. Oboril, M. B. Tahoori, Voltage Drop-Based Fault Attacks on FPGAs Using Valid Bitstreams, FPL 2017.
- G. Provelengios, D. Holcomb, R. Tessier, Characterizing Power Distribution Attacks in Multi-User FPGA Environments, FPL 2019.
- J. Krautter, D. R. Gnad, F. Schellenberg, A. Moradi, M. B. Tahoori, Active Fences against Voltage-based Side Channels in Multi-Tenant FPGAs, ICCAD 2019.
- K. M. Zick, M. Srivastav, W. Zhang, M. French, Sensing Nanosecond-Scale Voltage Attacks and Natural Transients in FPGAs, FPGA 2013.
- NIST, FIPS PUB 197: Advanced Encryption Standard (AES).
- RTL, board tooling, collection scripts, and the datasets behind these numbers